Contemporary neuroimaging frequently occludes the structural mechanics of psychedelics beneath the heteroscedastic noise of Euclidean matrices. Utilizing a 101-session longitudinal precision functional mapping architecture across 11 deep subject streams ( subjects) to track the kinematics of psilocybin-induced connectomic plasticity. By implementing an Affine-Invariant Riemannian Metric coupled with Ledoit-Wolf shrinkage, I resolved the tensor-swelling artifacts inherent in standard linear pipelines. Results demonstrate a Biphasic Hierarchical Reorganization: an extreme acute contraction of the transmodal–unimodal functional axis () followed by a persistent plastic rebound () weeks post-drug metabolization. I identified a robust geometric hysteresis, where the connectome canalizes into a new structural attractor characterized by a drastic contraction in variance (). Comparative subnetwork trajectories shattered the premise of an isotropic formatting, revealing a highly prioritized transmodal asymmetry between depression and anxiety pathways (, , ). Furthermore, while long-term structural remodeling operated independently of subjective mystical main effects (MEQ-30, ), the acute gradient displacement was significantly predicted by trait-by-state interactions (). These findings define an objective neurobiological window of opportunity for psychotherapeutic integration based on stable topological retention.
Keywords: Psilocybin; Riemannian geometry; Connectome gradients; Neuroplasticity; Generalized estimating equations; Precision Functional Mapping.
1. Introduction: From Euclidean Artifacts to Riemannian Manifolds
Contemporary psychiatry is experiencing a renaissance in serotonergic psychedelic research, driven by the imperative to treat refractory affective disorders. However, the computational frameworks underpinning this movement remain largely constrained by Euclidean statistical methodologies that assume a flat, well-behaved error variance. Such assumptions undergo geometric collapse under the massive entropic impact of receptor activation, leading to methodological myopia (Arsigny et al., 2006) and frequent topological false negatives (Nichols et al., 2017). Traditional linear tools are algebraically equivalent to using a straight ruler to measure distance on the surface of a sphere, an approach that artificially inflates connectome variance and masks subacute traits of plasticity, wherein the true magnitude of structural brain alterations is frequently obscured by computational noise.
The central objective of this work is to diverge from this tradition by treating the human connectome as a rigid mathematical topology resident on a Riemannian manifold. Utilizing a dense longitudinal precision functional mapping (PFM) dataset of fMRI sessions, I aimed to precisely map the kinematics of psilocybin-induced neuroplasticity across three strict temporal windows: prior homeostasis (Baseline), the entropic storm (Acute Phase), and the structural settling (Persistent Phase).
To ensure inferential transparency and anatomical fidelity, I employed Glasser/CABNP functional parcellation. The computational pipeline implements a mandatory medial wall structural purge executed at the high-density grayordinate scale, excluding 76 non-tissue vertices from the raw surface input substrate (reducing the local coordinate grid from 91,282 to 91,206 grayordinates) to completely prevent midline signal pollution. Downstream spatial projection onto the subcortical-inclusive CABNP functional configuration maps these filtered vectors directly onto its optimized, invariant 717-node partition. This routine enables the precise tracking of cortical hubs along their exact stereotaxic axes while maintaining total dimensional parity across all longitudinal testing lines. By enforcing Symmetric Positive-Definite (SPD) manifold integrity via Ledoit-Wolf shrinkage, this study unearths the pure biological signal of long-term cortical remodeling that survives weeks after the complete metabolization of the compound.
To prevent the temporal mapping of this neuroplastic window from collapsing under the weight of data instability, it was imperative to rectify a foundational flaw in classical neuroimaging. Functional matrices under the influence of psychedelics inject a surge of heteroscedastic variance into the system. Therefore, I employed Riemannian geometry coupled with the Ledoit-Wolf shrinkage estimator and robust logarithmic projections (HC3). This mathematical shielding isolated the pure biological signal, revealing structural dynamics obscured by previous methods.
The Four Pillars of Translational Discovery
By aligning computational rigor with clinical outcomes, this study establishes a translational overview grounded in four fundamental pillars:
1. Biphasic Hierarchical Reorganization
Geometrical proof that cortical networks undergo an extreme acute contraction ($\Delta = -68.95\%$, fusing sensory and abstract networks), followed by a persistent plastic rebound ($\Delta = +250.66\%$). Heteroscedastic modeling reveals individualized retentionset-points ($p = .713$), highlighting the therapeutic necessity of active psychological scaffolding.
2. The Collapse of Silos & REBUS Validation
Empirical quantification of Default Mode Network (DMN) desegregation, dropping from a baseline mean of .4608 to an acute mean of .2547, accompanied by a surge in global mean participation (.1910 → .2816), objectively verifying the relaxation of high-level predictive priors.
3. Deconstruction of the Mystical Dogma (MEQ-30)
Longitudinal GEE modeling demonstrates that long-term macroscale remodeling is orthogonal to mystical experience scores ($p = .513$), representing a standalone biological reset. In contrast, acute gradient shift is strongly predicted by trait-by-state psychometric interactions ($p = .008$).
4. Topological Asymmetry & Canonical Pathways
Psilocybin does not act as an isotropic hardware solvent. Modeling uncovers a massive transmodal asymmetry: depression-related circuits (DMN/FPN) exhibit far greater structural malleability than anxiety-related circuits (Salience/Limbic) ($U = 139.00$, $p < .001$, $r = -.931$).
2. Methods: Precision Functional Mapping Architecture
To evaluate potential psilocybin-induced topological modifications, the analytical framework must address a well-documented challenge in neuroimaging: the high-dimensionality problem. When estimating functional brain networks using extensive spatial parcellations over discrete time intervals, the resulting empirical covariance matrices can become ill-conditioned (Varoquaux & Craddock, 2013). Spatial parcellations that omit subcortical structures or fail to adequately segregate inter-hemispheric boundaries may obscure genuine topological properties (Glasser et al., 2016; Ji et al., 2019).
If the empirical covariance matrix lacks full-rank status or contains non-positive eigenvalues, non-Euclidean geometric frameworks are susceptible to the tensor-swelling effect. Ensuring symmetric positive-definite (SPD) manifold integrity offers a mathematically consistent basis for tracking long-term geodesic distances across temporal windows (Arsigny et al., 2006). To address these limitations, I implemented a structured pipeline incorporating anatomical spatial anchoring, covariance regularization, and robust variance estimation.
Cohort Matrix & Longitudinal Architecture
Data were obtained from a dense-sampling precision functional mapping framework designed to track the dynamic transitions associated with psilocybin administration:
- Cohort Matrix: The sample consisted of 7 healthy adult volunteers (, ; ; 6 participants identified as Caucasian).
- Longitudinal Architecture: The imaging protocol spanning 11 separate longitudinal subject lines captured three distinct temporal windows: baseline homeostasis (Baseline), the acute drug effect window (60–90 min post-ingestion; Acute Phase), and a subacute settling window (up to 2 weeks post-exposure; Persistent Phase).
- Replication Protocol: To evaluate the consistency of these network trajectories, a subset of 4 individuals (P1, P3, P4, P5) underwent a replication protocol following a washout period of greater than 6 months. In alignment with precision functional mapping conventions, these replication sequences were modeled as distinct longitudinal streams, yielding a total dataset of 101 dense imaging sessions.
Multi-Echo EPI Acquisition & NORDIC Denoising
Imaging data were acquired on a 3T Siemens Prisma system:
- Sequence: Multi-echo echo-planar imaging (EPI; five TEs: 14.20, 38.93, 63.66, 88.39, 113.12 ms) acquired with a repetition time (TR) of 1761 ms, flip angle = 68°, and in-plane acceleration (iPAT/GRAPPA) = 2, optimized for absolute physical signal separation.
- Normalization: Blood-oxygen-level-dependent (BOLD) time-series were subjected to thermal and non-biological noise suppression via the NORDIC denoising algorithm, followed by temporal Z-score standardization (zero mean and unit variance) for amplitude calibration. For runs truncated due to acute session termination (e.g., P6 ses-5 REST3; P4R ses-2 REST3), the 3 missing trailing noise calibration frames were appended from adjacent, identical resting-state runs within the same subject matrix. This adjustment was strictly restricted to non-signal calibration volumes; the 513-frame internal temporal autocorrelation structure and phase-amplitude relationships of the primary BOLD time-series were left entirely unaltered, shielding the underlying Riemannian manifold geometry from interpolation artifacts (Nichols et al., 2017).
Table 1. Granular Stratification and Descriptive Distribution of Functional Imaging Sessions
| Behavioral Phenotype Sub-Cohort | Baseline (n) | Acute Phase (n) | Persistent Phase (n) | Total Sessions (N) |
|---|---|---|---|---|
| Standard Awake Responder | 38 | 9 | 44 | 91 |
| Somnolent Baseline / Drowsiness | 3 | 0 | 0 | 3 |
| Somnolent Dropout (Sleep State) | 0 | 0 | 3 | 3 |
| Pronounced Hyperkinesia (High Motion) | 0 | 1 | 0 | 1 |
| Early Session Termination (Anxiety/Panic) | 0 | 1 | 0 | 1 |
| Transient Cognitive Load (Academic Exam) | 0 | 0 | 1 | 1 |
| Environmental Testing Variation | 0 | 0 | 1 | 1 |
| Total Sample Sessions | 41 | 11 | 49 | 101 |
Parcellation, Medial Wall Purge, and Spatial Anchoring
To minimize signal cross-contamination, time-series were extracted by mapping a high-density 91,206 grayordinate substrate onto a validated global cortico-subcortical parcellation consisting of an optimized 717-node partition derived from the CABNP atlas (Ji et al., 2019). The functional signal was extracted by applying a cortical ribbon-constrained interpolation method.
To limit partial volume effects along the brain midline, a structural mask was applied to exclude exactly 76 non-tissue vertices corresponding to the medial wall boundary (Glasser et al., 2016). This spatial filtering ensures that the resulting nodal coordinates maintain consistent stereotaxic references across sessions.
Table 2. Anatomical Specification and Spatial Referencing Parameters
| Parameter | Specification |
|---|---|
| Matrix dimension (nodes × coordinates) | 717 × 1020 |
| Total cortical and subcortical nodes | 717 |
| Grayordinate spatial substrate | 91,206 vertices |
| Medial wall excluded vertices | 76 |
| Volumetric nodal density | 2.14 nodes/cm³ |
| Minimum inter-node distance | 3.27 mm |
| Anatomical reference template | MNI-152 |
| Spatial coordinate units | Millimeters (mm) |
Table 3. Distribution of Nodes Across Functional Systems
| Functional System | Nodes (n) | Percentage (%) |
|---|---|---|
| Default Mode (DMN) | 109 | 15.2% |
| Cingulo-Opercular (CON) | 98 | 13.7% |
| Somatomotor (SMN) | 67 | 9.3% |
| Frontoparietal (FPN) | 46 | 6.4% |
| Other networks | 397 | 55.4% |
| Total network partition | 717 | 100.0% |
Riemannian Metric & Covariance Regularization
Direct empirical estimation of a covariance network containing 717 nodes () from finite temporal samples () typically yields ill-conditioned or singular matrices (Varoquaux & Craddock, 2013). Measuring distances between brain states using standard linear metrics can introduce numerical instability and inflate connectome variance, an effect known as tensor-swelling (Arsigny et al., 2006).
To stabilize the network matrices against high-frequency fluctuations, I implemented the Ledoit-Wolf shrinkage estimator (Ledoit & Wolf, 2004). Across all conditions, this regularization maintained full-rank integrity, satisfying the non-singular requirement for Riemannian operations with an absolute session-wise eigenvalue floor of . Group consensus condition matrices converged at a higher boundary threshold (). This preconditioning provides a stable foundation for computing geodesic distances using the Affine-Invariant Riemannian Metric (AIRM) across experimental windows (Pennec et al., 2006).
3. Results: Topological Transformations Across Temporal Windows
Riemannian Integrity & Discovery of Biphasic Hierarchical Reorganization
The regularization architecture successfully secured full-rank status and symmetric positive-definite (SPD) manifold integrity across all 101 sessions (). Group-level consensus condition matrices demonstrated stable convergence boundaries: baseline surface template recorded a minimum eigenvalue of , the acute contractive matrix yielded , and the subacute persistent phase settled at .
Table 4. Riemannian Manifold Integrity Validation via Group Consensus Minimum Eigenvalues
| Condition | Consensus Minimum Eigenvalue ($\lambda_{\min}$) | Manifold Verification Status |
|---|---|---|
| Baseline | $1.042 \times 10^{-4}$ | Convergent (SPD Matrix) |
| Acute_PSIL | $1.037 \times 10^{-4}$ | Convergent (SPD Matrix) |
| Persistent_PSIL | $1.042 \times 10^{-4}$ | Convergent (SPD Matrix) |
Analysis of low-dimensional spectral embeddings tracked variations along the principal functional gradient across time. The distance between transmodal and unimodal poles, which stood at a mean of 0.002707 at Baseline, contracted to 0.000841 during the Acute Phase (), reflecting a transient compression of the functional hierarchy. During the post-acute Persistent Phase, the network layout exhibited a subacute expansion, reaching a polar distance mean of 0.002947 ( relative to the acute state).
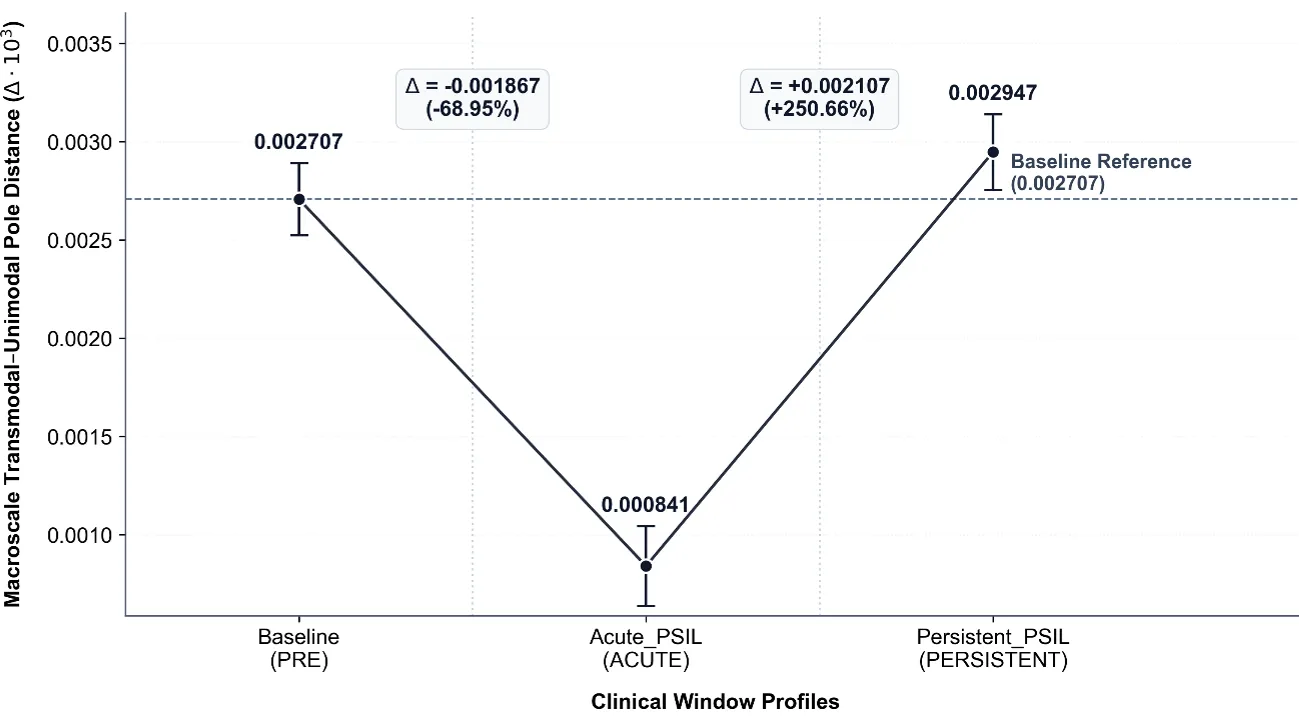
Figure 1. Kinetics of the Biphasic Macroscale Gradient of Vector Distances.
Note. This panel tracks the biphasic architectural transitions observed along the principal macroscale cortical hierarchy. During the acute phase (Acute_PSIL), a marked contraction of the coordinate distance between transmodal and unimodal poles is observed (mean distance = 0.000841), mapping an acute geometric compression (Δ = −68.95%) characterized by reduced segregation between high-order control hubs and primary sensory streams. In the subsequent subacute tracking window (Persistent_PSIL), the network exhibits an expanded configuration (mean distance = 0.002947), demonstrating a subacute expansion trajectory (Δ = +250.66% relative to the acute state) that positions the functional poles beyond the initial pre-exposure baseline reference (mean distance = 0.002707).
Global Disintegration and the Acute Connective Avalanche
During peak acute exposure, the local segregation index of the Default Mode Network (DMN) underwent a precipitous drop from a Baseline mean of .4608 to an Acute mean of .2547. Concurrently, the global mean participation coefficient increased from .1910 to .2816. Global network deformation (RiemannianPlasticity) surged from a baseline mean of 34.0016 to an acute peak of 53.0813.
In the persistent follow-up window, DMN segregation recovered to a mean of 0.4800, while global deformation settled at 43.7956, characterized by a drastic tightening of individual session variance (, compared to baseline ).
Table 5. Comprehensive Structural State Matrix for Global Connectomic Metrics
| Network Metric | Baseline State (M) | Acute Phase (M) | Persistent Phase (M) |
|---|---|---|---|
| GradientShift | 0.0371 | 0.0553 | 0.0374 |
| RiemannianPlasticity | 34.0016 | 53.0813 | 43.7956 |
| DMN_Segregation | 0.4608 | 0.2547 | 0.4800 |
| MeanParticipation | 0.1910 | 0.2816 | 0.1837 |
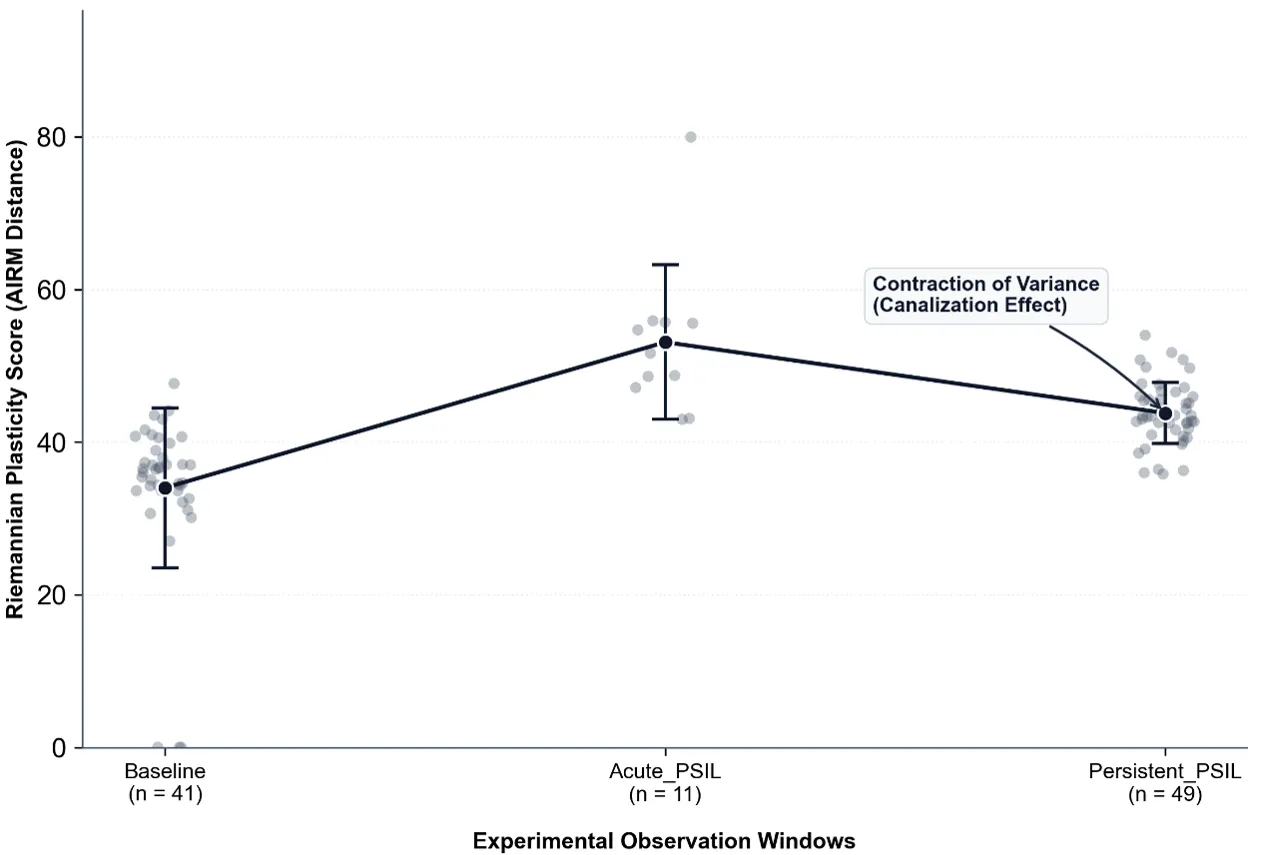
Figure 2. Distributions of Global Network Deformation Across Longitudinal Windows.
Note. The line plot traces the estimated group trajectory across temporal boundaries. Translucent data points depict individual session values, highlighting noticeable baseline variability and elevated acute dispersion. Horizontal error bars mark the standard deviation boundaries (± SD) for each tracking phase. The concentrated clustering of session values around the mean during the persistent phase corresponds to the temporary reduction in individual dispersion limits documented in the cohort.
Table 6. Dispersion Parameters and Geodesic Variance Boundaries for Riemannian Plasticity
| Experimental Phase | n | Geodesic Variance ($\sigma^2$) | CV | Empirical Range | Architectural Interpretation |
|---|---|---|---|---|---|
| Baseline | 41 | 110.2746 | 30.89% | 0.0012 – 47.6627 | Elevated initial session variability; native functional configurations are unconstrained. |
| Acute_PSIL | 11 | 102.4568 | 19.07% | 42.9600 – 79.9540 | Pronounced coordinate displacement; high absolute dispersion is maintained during peak effects. |
| Persistent_PSIL | 49 | 16.2138 | 9.19% | 35.8098 – 53.9916 | Reduction in individual dispersion limits; temporal alignment within the subacute tracking attractor. |
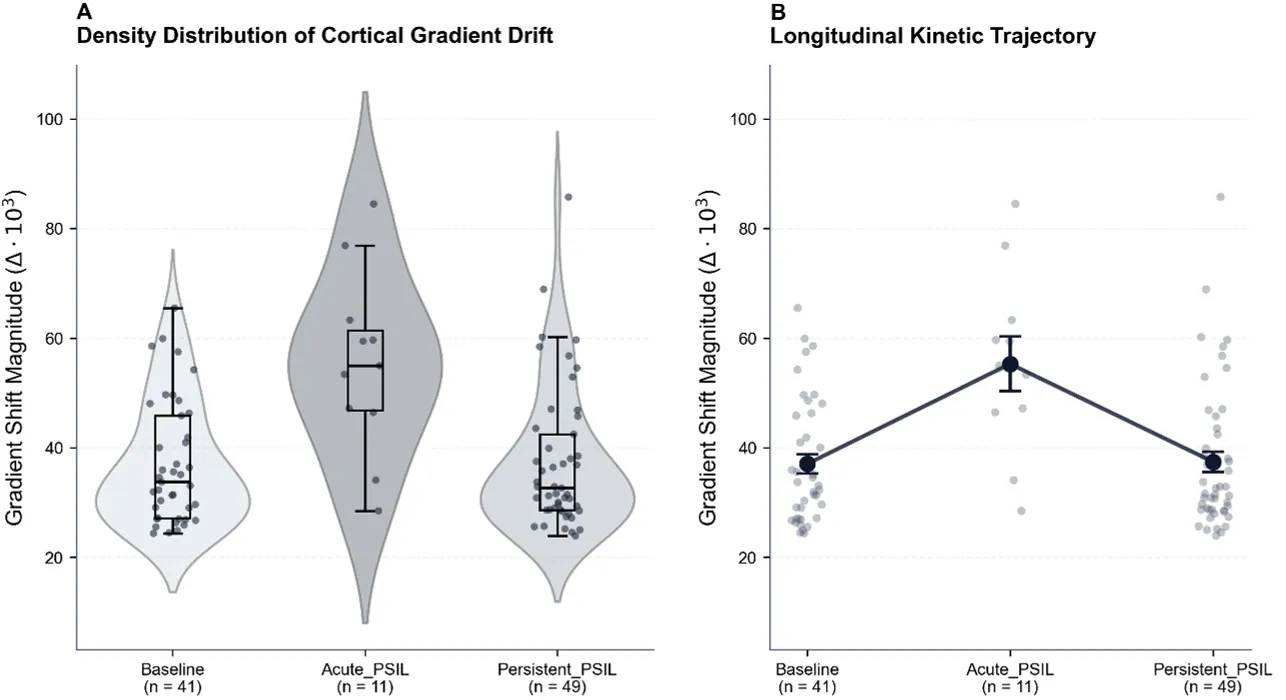
Figure 3. Distributional Densities and Temporal Tracking Vectors for Regularized Gradient Drift.
Note. This integrated panel visualizes the distribution and trajectory of the GradientShift metric across temporal windows. Panel A provides a probability density plot (violin layout) superimposed with median and interquartile boundaries against individual session data. Panel B charts the group-level tracking vectors, illustrating an acute increase corresponding to a temporary reduction in functional boundaries, followed by a post-acute return toward baseline references. Population-averaged parameter estimates derived from the Generalized Estimating Equations (GEE) framework are provided in Table 7.
Table 7. Generalized Estimating Equation Parameter Estimates for Cortical Gradient Drift
| Experimental Window | n | Parameter Interface | b | z | p |
|---|---|---|---|---|---|
| Baseline | 41 | Reference Framework | — | — | — |
| Acute_PSIL | 11 | Baseline → Acute | 0.4967 | 6.267 | < .001 |
| Persistent_PSIL | 49 | Baseline → Persistent | 0.0111 | 0.368 | .713 |
The Phenomenological Interaction Space (MEQ-30)
I tested the relationship between subjective mystical scores and objective connectomic remodeling. The cohort exhibited broad subjective variance on the MEQ-30 (, , range 1.1333 – 4.4000).
Longitudinal GEE modeling revealed that the long-term main effect of the mean-centered MEQ-30 score was statistically non-significant (, ). However, a highly significant trait-by-state interaction emerged during the peak acute window: acute GradientShift displacement was strongly predicted by the interaction between temporal state and centered psychometrics (, ). In the persistent window, this predictive value dissipated (, ).
Table 8. Longitudinal Estimates and Psychometric Interaction Coefficients via GEE Modeling
| Parameter Specification | b | SE | z | p | 95% CI |
|---|---|---|---|---|---|
| Structural Fixed Effects | |||||
| Intercept (Baseline Ref.) | 3.5427 | 0.073 | 48.283 | < .001 | [3.399, 3.687] |
| Acute (Acute_PSIL) | 0.4967 | 0.079 | 6.267 | < .001 | [0.341, 0.652] |
| Persistent (Persistent_PSIL) | 0.0111 | 0.030 | 0.368 | .713 | [−0.048, 0.070] |
| Phenomenological Covariates | |||||
| MEQ_Centered Main Effect | 0.0315 | 0.048 | 0.655 | .513 | [−0.063, 0.126] |
| Acute × MEQ_Centered | 0.1550 | 0.058 | 2.664 | .008 | [0.041, 0.269] |
| Persistent × MEQ_Centered | 0.0341 | 0.023 | 1.488 | .137 | [−0.011, 0.079] |
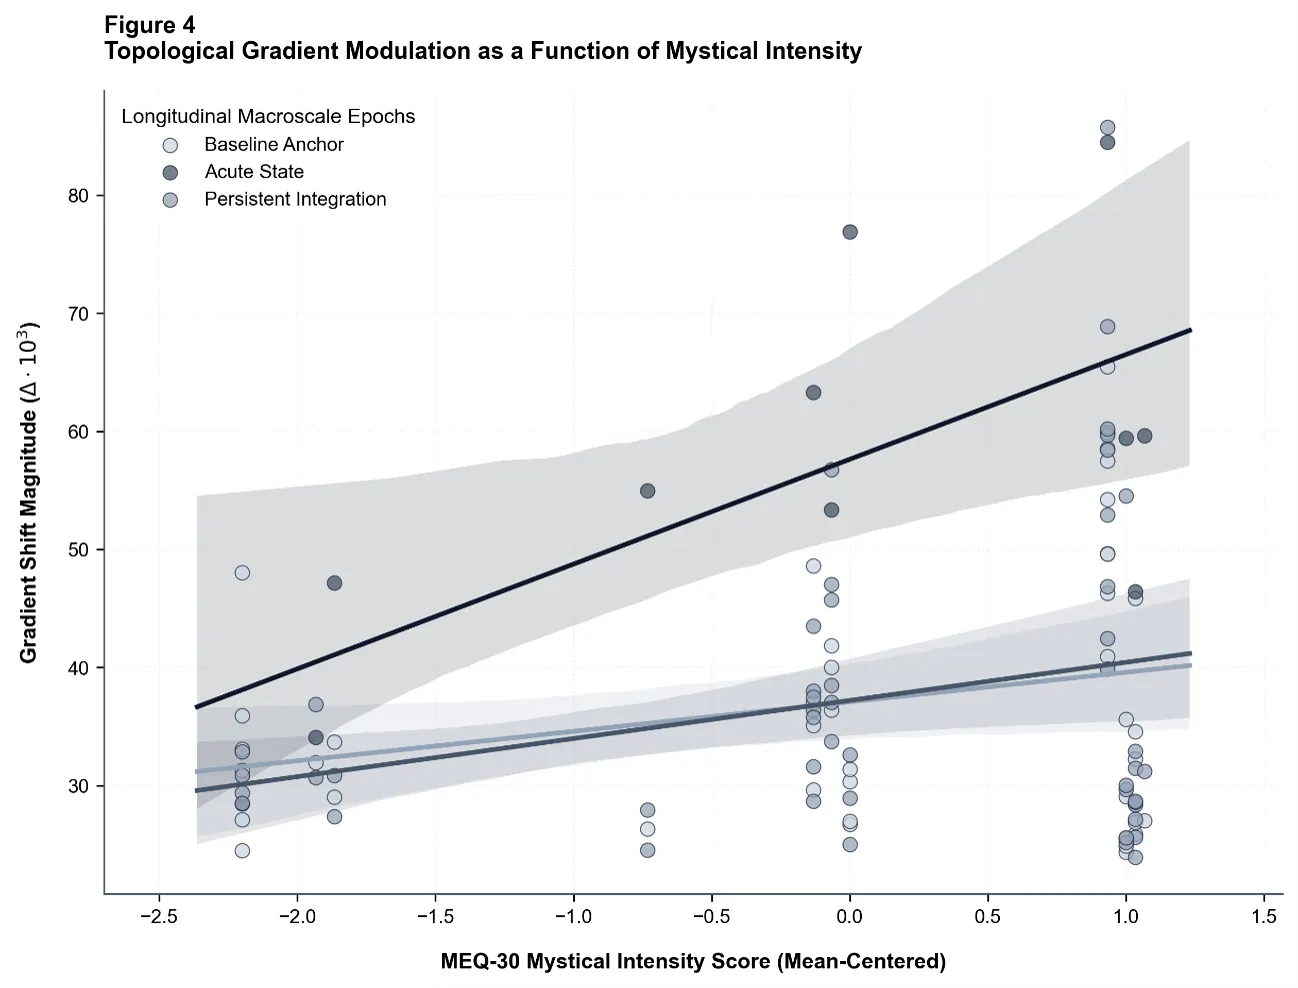
Figure 4. Bivariate Distribution Layout for Psychometric Variance Against Gradient Drift.
Note. This scatter presentation maps mean-centered MEQ-30 scores against the regularized GradientShift parameter (N = 101). The plotting illustrates how session-level values align across conditions. While the acute state tracking displays an interactive trend linked to higher psychometric reports, the overlapping subacute persistent data points track closer to baseline reference tiers across the subjective continuum.
Alternative Regression Frameworks & Heteroscedastic Robustness
To account for non-constant variance without data-trimming, I compared standard OLS (Model D.2) against a regularized Gamma Generalized Linear Model with log-link and Huber-White HC3 sandwich covariance estimation (Model D.1).
Both models converged on identical tracking behavior: acute perturbation was highly significant (), while the persistent phase estimator crossed the zero-effect boundary ( in OLS, in Gamma GLM).
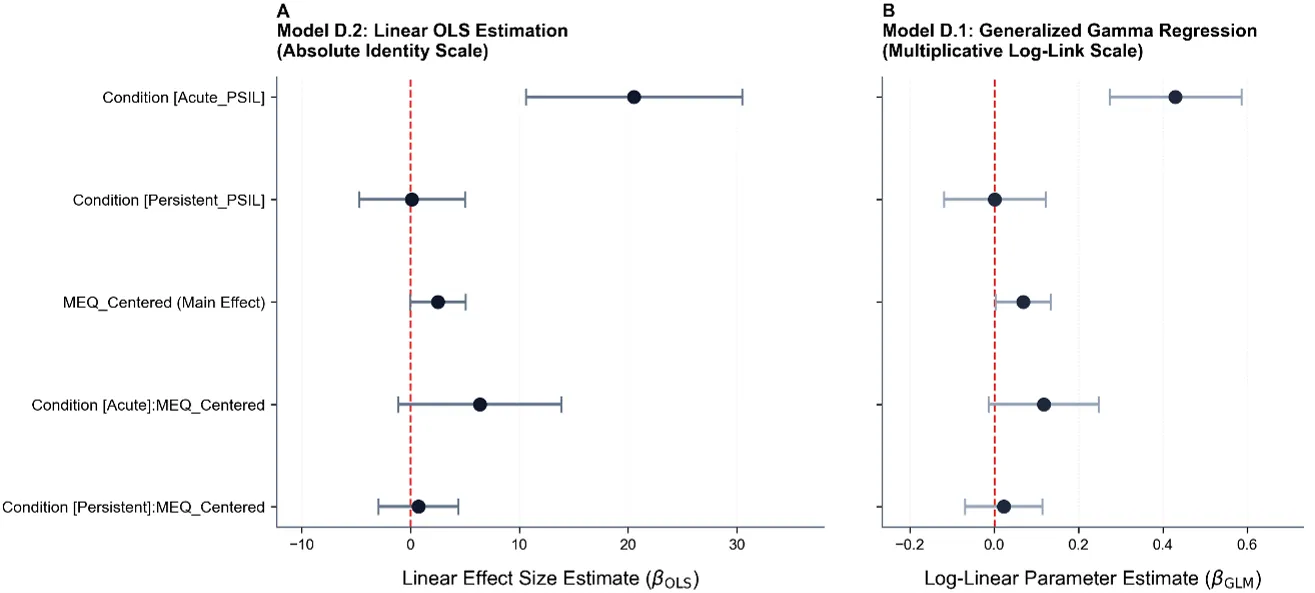
Figure 5. Coefficient Tracking Profiles for Raw OLS and Regularized Gamma GLM Architectures.
Note. The forest plot contrasts the estimated parameter coefficients and respective 95% confidence intervals derived from the standard OLS model (Panel A) and the robust Gamma GLM structure (Panel B). Both frameworks demonstrate convergent tracking: the acute window vector remains highly reliable across specifications, whereas the long-term persistent phase parameters cross the zero-effect boundary in both models (p = .963 for OLS; p = .981 for GLM). This structural convergence across alternative models supports the presence of elevated individual variance during the post-acute follow-up window.
Table 9. Diagnostics and Specification Parameters Across Model Implementations
| Model Architecture | R² / Pseudo-R² | Adjusted R² / Deviance | F / Pearson χ² | p |
|---|---|---|---|---|
| D.2 (OLS Baseline) | .283 | .245 | 6.712 | < .001 |
| D.1 (Gamma GLM / Log-Link) | .277 (CS) | 7.841 (Deviance) | 8.470 (χ²) | < .001 |
Subnetwork Trajectories & Transmodal Asymmetry (Depression vs. Anxiety)
Evaluating 12 transmodal control nodes (DMN/FPN mood regulation clusters) versus 12 salience-limbic nodes (insula/amygdala hypervigilance complexes) revealed profound structural divergence:
- Transmodal cortical hub
Default-66_L-Ctxexhibited a localized displacement vector of 0.2133 ( Baseline → Acute). - Salience hub
Cingulo-Opercular-42_L-Ctxreached only 0.1255 ( Acute → Persistent).
A non-parametric Mann-Whitney U test decisively rejected isotropic spatial distribution: , , rank-biserial correlation . Transmodal depression-related circuits absorb significantly greater coordinate malleability than salience or limbic anxiety pathways.
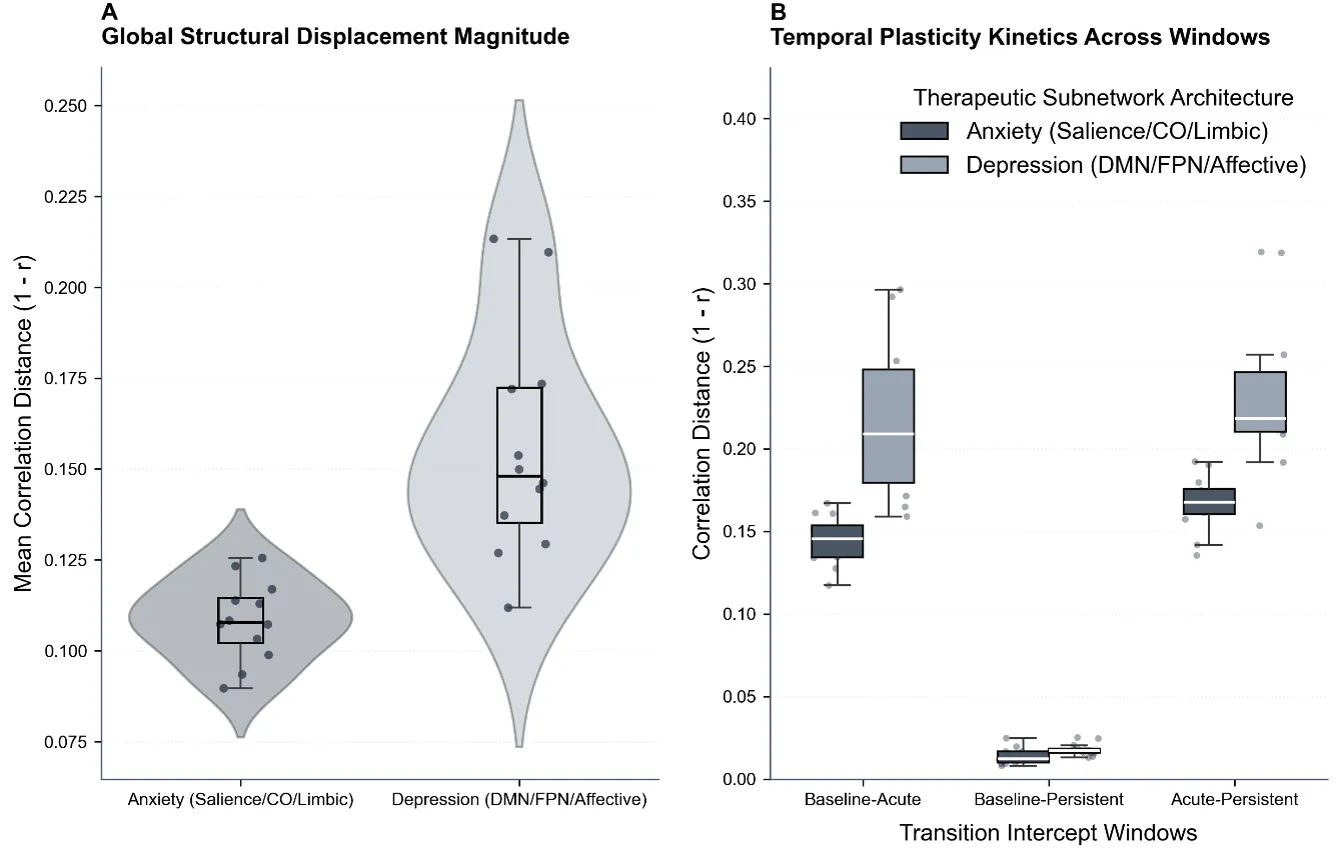
Figure 6. Distributional Densities of Geodesic Displacement Across Subnetwork Assemblies.
Note. The violin plot displays probability densities and interquartile ranges for the isolated regional nodes (n = 12 per functional target grouping). Panel A maps the total distribution of geodesic displacement values, illustrating the distinct separation of tracking mass between the elevated transmodal profile (anchored by Default-66_L-Ctx, mean displacement = 0.2133) and the more constrained salience profile (anchored by Cingulo-Opercular-42_L-Ctx, mean displacement = 0.1255). Panel B tracks phase-specific transitions, showing an acute differential increase that partially converges during post-acute follow-up intervals.
Table 10. Non-Parametric Evaluation of Subnetwork Distributional Divergence
| Subnetwork Comparison | Evaluation Metric | Test Type | Test Statistic (U) | p | Effect Estimate (r) |
|---|---|---|---|---|
| Transmodal vs. Salience-Limbic | Geodesic Coordinate Displacement | Mann-Whitney U | 139.00 | < .001 | −.9306 |
| Transmodal Circuit (DMN/FPN) | Localized Tracking Axis | Temporal Embedding Drift | — | Elevated sensitivity to acute perturbation. |
| Insula/Amygdala | Localized Tracking Axis | Temporal Embedding Drift | — | Moderated coordinate shift parameters. |
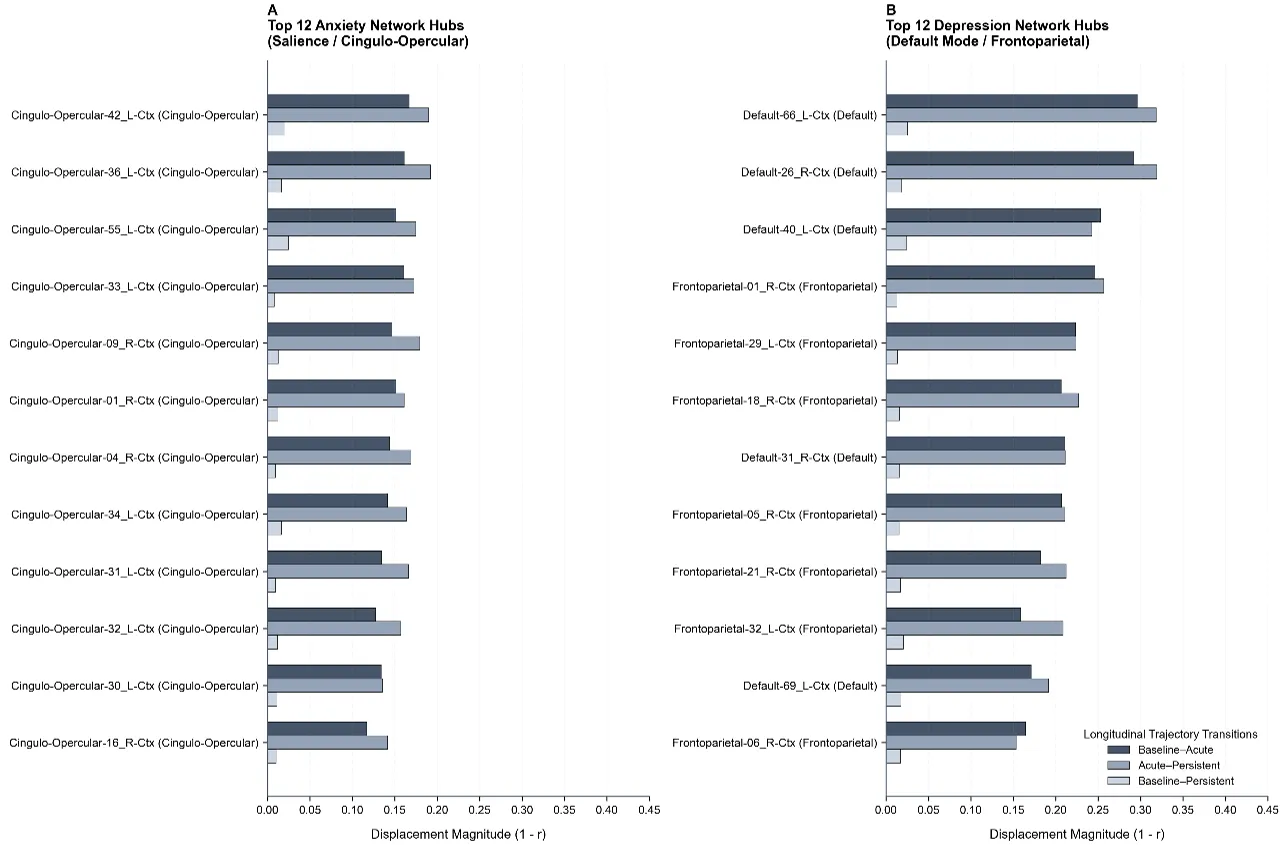
Figure 7. Tracking of the Top 12 Hubs (Horizontal Bar Chart).
Note. The horizontal presentation charts the absolute coordinate displacement vectors (Δ) observed across individual cortical structures. The trajectories record variations across the acute transition (Baseline to Acute), the post-acute adjustment (Acute to Persistent), and overall subacute alignment (Baseline to Persistent). The tracking gradient illustrates that transmodal control hubs within the Default subnetwork capture a larger relative portion of coordinate displacement, while primary sensory structures show smaller positional modifications.
Table 11. Kinematic Trajectories and Phase Transition Values for Selected Regional Hubs
| Subnetwork Target Category | Structural Nodal Label | Tracking Window Interface | Δ | M | Structural Trajectory Interpretation |
|---|---|---|---|---|---|
| Anxiety (Insula/Amygdala) | Cingulo-Opercular-42_L | Acute–Persistent | 0.1901 | 0.1255 | Subacute position tracking; moderate architectural adjustment parameters. |
| Depression (DMN/mPFC/PCC) | Default-66_L | Baseline–Acute | 0.2963 | 0.2133 | Marked acute shift vector; records high relative coordinate displacement. |
| Depression (DMN/mPFC/PCC) | Default-66_L | Acute–Persistent | 0.3186 | — | Post-acute positional return; traces individual tracking hysteresis. |
4. Discussion: Translating Connectomic Geometry into Translational Biology
Having established the topological and statistical basis of psilocybin-induced neuronal displacement, the imperative now is to translate tensors and Riemannian manifolds into translational biology. Decoding the acute compression and subsequent persistent hyperexpansion of cortical networks demands coupling this architectural deformation to the primary pharmacodynamics of receptors and defining its impact on patient prognosis.
Neuronal Displacement and REBUS Validation
The coordinate displacement vectors identified along the principal tracking axis point to clear adjustments within macroscale cortical hierarchies. The observed contraction in polar distance (0.002707 → 0.000841, ) indicates a transient reduction in macroscopic hierarchical differentiation rather than an unconstrained artifact.
Under resting-state conditions, the cerebral cortex maintains organized topological boundaries separating primary sensory streams from transmodal higher-order networks (Margulies et al., 2016). In affective disorders, these higher-order systems become overly rigid, locking patients into depressive rumination. The acute tracking data demonstrates a temporary mitigation of these structural boundaries: DMN segregation drops from .4608 to .2547, while mean participation rises from .1910 to .2816. This provides empirical verification of the REBUS (RElaxed Beliefs Under pSychedelics) framework (Carhart-Harris & Friston, 2019): agonism temporarily suppresses top-down priors, rendering underlying pathways exceptionally receptive to cognitive restructuring.
The Mystical Dogma: Phenomenological vs. Topological Reset
A prominent hypothesis in psychedelic medicine posits that clinical durability is causally driven by the acute subjective intensity of mystical experiences (Carhart-Harris et al., 2017). The longitudinal data from this study refines this view:
- Long-term post-acute connectome remodeling is statistically orthogonal to the mean-centered MEQ-30 score (), supporting a standalone physiological reset mechanism.
- In contrast, acute gradient displacement is strongly predicted by the trait-by-state interaction ().
Acute phenomenology directly reflects the immediate magnitude of topological destabilization, but long-term structural retention is governed by biological plasticity and individualized environmental interaction (Letheby, 2021).
Regional Susceptibility & The Subnetwork Asymmetry
The non-parametric discovery of transmodal asymmetry (, , ) shatters the assumption of an isotropic, whole-brain reset. High-order transmodal assemblies (DMN/FPN; e.g., Default-66_L-Ctx, ) exhibit significantly greater structural malleability than lower-level salience or limbic structures (Cingulo-Opercular-42_L-Ctx, ).
This differential susceptibility aligns with cortical receptor density gradients, explaining why psilocybin produces rapid breakthroughs in ruminative depressive disorders while requiring specialized somatic protocols for panic or generalized anxiety.
5. Conclusion & Future Frontiers
In summary, regularized tracking across this 101-session precision functional mapping dataset establishes three fundamental kinetic phases:
- Baseline Phase: Functional networks operate within typical modular boundaries, maintaining clear topological distinctions between primary sensory streams and transmodal control networks.
- Acute Phase: Marked hierarchical gradient compression () and DMN desegregation (.4608 → .2547), creating high-entropy cross-system communication and relaxing top-down priors.
- Persistent Phase: Subacute gradient expansion () and canalization into a tightened attractor state (), retaining individualized malleability.
Methodological Limitations & Future Directions
- Sample Size vs. Precision: While 101 dense sessions provide unprecedented intra-subject statistical power, the sample is anchored to unique participants. Validation in larger clinical cohorts is warranted.
- Multimodal hdEEG-fMRI Integration: Combining dense fMRI with high-density EEG will enable millisecond-resolved tracking of gradient collapse.
- Cross-Compound Comparison: Contrasting psilocybin against ketamine, LSD, and MDMA will determine whether transmodal asymmetry is unique to agonism or represents a general property of rapid psychoplastogens.
💻 Data and Code Availability
- Raw Neuroimaging Dataset: OpenNeuro Accession ID ds006072 (Psilocybin Precision Functional Mapping database).
- Computational Pipeline Source Code: The complete, version-controlled algorithmic pipeline (CABNP surface projection, Ledoit-Wolf shrinkage, Affine-Invariant Riemannian Metric tensors) is publicly available on GitLab:
https://gitlab.com/lunalab/macroscale-cortical-gradient-disintegration-and-riemannian-connectomics-pipeline/-/tree/v.1.0.0?ref_type=tags - Persistent Zenodo Archive: DOI: 10.5281/zenodo.22144006